
Timeseries Database and Visualization
This page is under construction. Please check back later for updates.
Introduction
The figure below shows a typical data engineering pipeline for a production system, where each block is a microservice launched from a Docker container. Docker is used for ease of deployment, environment agnostic characteristics, modularity (i.e., microservice), scalability, and maintainability in the long run.
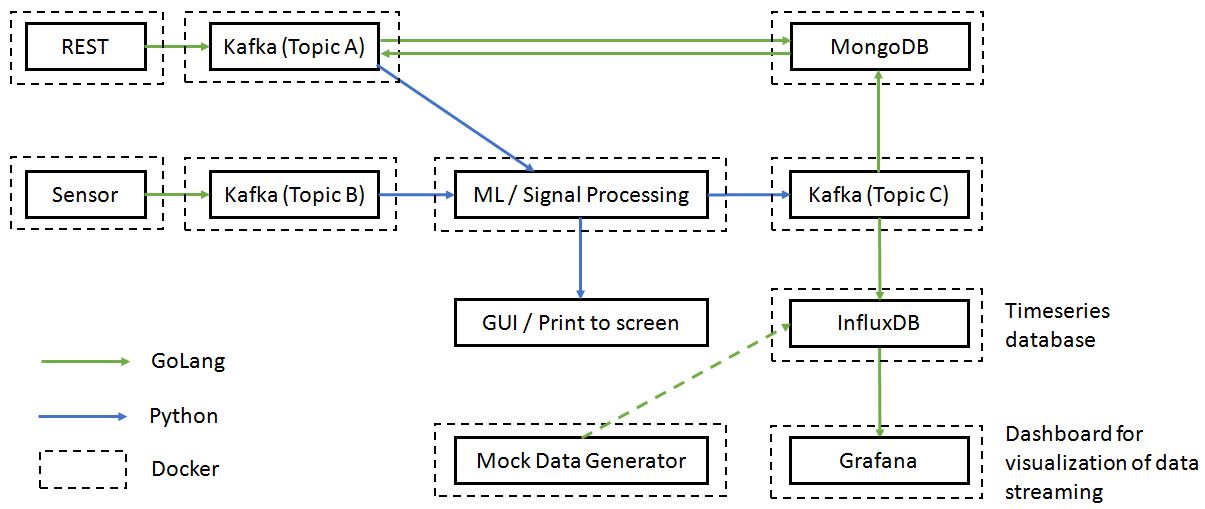
It consists of
- REST api
- Streaming of sensor inputs
- Kafka for message queueing/passing
- Signal processing blocks
- Database (e.g., MongoDB, InfluxDB)
- Visualization tool (e.g., Grafana)
- GUI
In this project, we focus purely on developing the timeseries database, InfluxDB, and visualizing of the timeseries data using Grafana. For simplicity, the input to InfluxDB is simulated using a mock data generator. Building the remainder of the data pipeline shown above is discussed in my other two projects, namely, IceCream API and RTSP Video Streaming, Kafka, and Microservices projects.
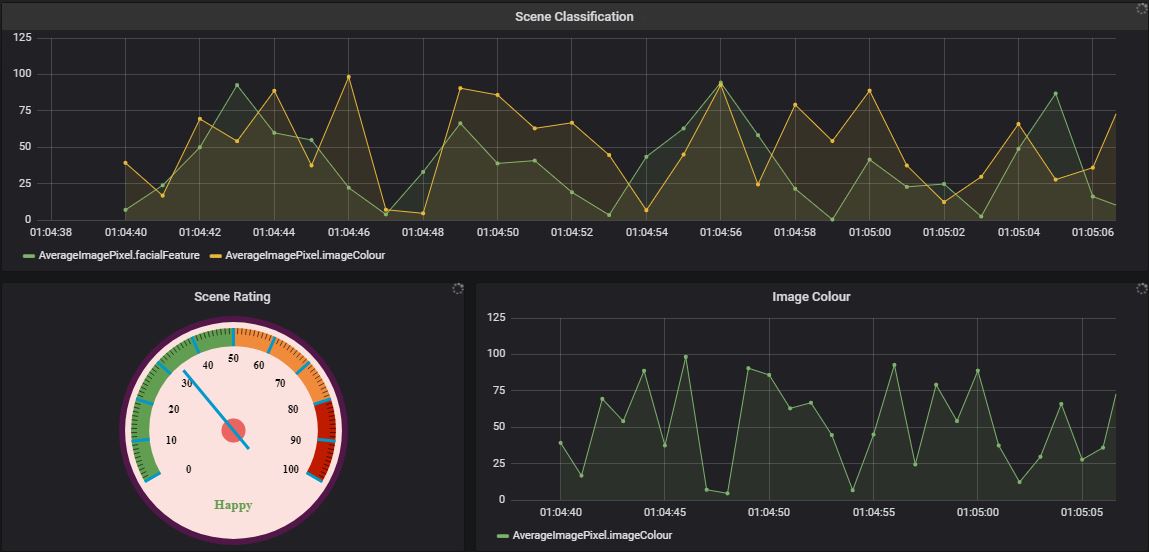
The end product of this project should appear as follows.
Learning Outcome
The repository contains the following:
At the end of this project, we should be able to:
- use dockerized InfluxDB and Grafana
- visualize timeseries data in Grafana
- query time series data in Grafana
Project Structure
The project structure is as follows:
Timeseries-Database         # Main folder
├── influxdbgrafana         # Docker container for InfluxDB and Grafana
│   ├── grafana             #
│   │   └── Demo.json       # Json file describing the Grafana layout
│   └── Docker-compose.yml  # To instantiate Docker container
└── gotimeseries            #
    ├── Docker-compose.yml  # To instantiate Docker container
    ├── Dockerfile          # To build Docker image
    └── main.go             # Go code (with mock data generator) feeding to InfluxDB
Leave a comment